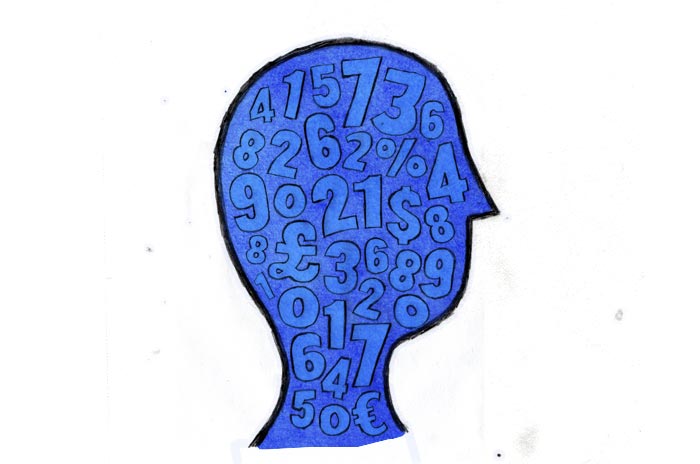
Was surprised to see graphic design featured on Newsnight recently with a discussion on data visualisation. Although it was great to see it covered on mainstream news, the debate could maybe have better expressed the benefits of well presented data.
What is an infographic?
There’s nothing more boring than data. Unless your’e an economist or an accountant, most people’s eyes start forcing themselves shut as soon as they have to process a sheet load of facts and figures. That can leave the audience of an important presentation switching off and tuning out. Infographics are graphical representations of data and although you could say a simple graph is an infographic, the term has come to mean graphics with much more visual allure, making the experience much more engaging than a pie chart ever could. Through beautifully arranged typography, illustration or animation, an infographic can add drama and appeal to data.
Style over Substance?
Possibly in some cases, yes. In any design discipline you will find always examples of work that is ineffective or just plain ugly. When the data is clouded by an overly elaborate graphic style, when the design is laden with clichés or out of context, then an infographic loses its purpose and effectiveness. However when the result of an infographic is that it has generated more interest in the data, or brought attention to the more important points, then you can say has done its job. Some would argue (as put forward on Newsnight) that focus can be forced in the direction of the designer / authors point of view. This is a valid point, but it then moves into the much wider debate of manufactured opinion.
Simplicity from Complexity
When you read a for book written for young children, each page or spread is normally illustrated to illuminate the story and captivate the child’s imagination. As the target age goes up, the stories get a little more complicated. At this point the illustrations give a summary of what’s happening in the story on that page. The same method applies in data visualisation, with the statistics and message being summarised graphically so its accessible and memorable to readers with little or no knowledge of a complex subject.
Visual Hierarchy
Whether it’s a website design, an advertisement or any piece of graphic design that involves informing or promoting to an audience, structure is essential. Once the data is refined it can be arranged into a sequence that progresses logically from one point to another. Once the sequence is decided on, special emphasis can be given to things that matter most to the story to make sure these are the points that stand out and stick in the mind.
Do I Need an Infographic?
Any new or little known product or service needs an introduction. Whether it’s an explanation of how it works or why it’s needed, an infographic can add style and significance to the sales pitch. As an animated intro to a website, infographics can promote interest, inspire and elevate the perception of the brand image. This leaves a lasting effect on viewers and adds credibility to the message.
What is an infographic?
There’s nothing more boring than data. Unless your’e an economist or an accountant, most people’s eyes start forcing themselves shut as soon as they have to process a load of facts and figures. That can leave the audience of an important presentation switching off and tuning out. Infographics are graphical representations of data and although you could say a simple graph is an infographic, the term has come to mean graphics with much more visual allure, making the experience much more engaging than a pie chart ever could. Through beautifully arranged typography, illustration or animation, an infographic can add drama and appeal to data.
Further Reading
Information is Beautiful
Visual.ly
Infographics: The Power of Visual Storytelling
Information Graphics – Taschen
Data Flow: v. 2: Visualizing Information in Graphic Design
